Reading an open space audit from the plot
A council assesses its open space by measuring what is there, comparing it with what policy expects, and mapping who can reach it. The audit records surfaces by type, tests the supply against a standard, and draws catchment areas around each site. A gardener on a plot can use the same three moves to read their own ground: measure, compare, map.
The editors of Notes from W4 –
How a PPG17 open space assessment worked
PPG17 was the planning guidance that set the pattern for open space work in England until the National Planning Policy Framework replaced it. The method was not a single survey but a sequence. First came an audit: every open space in the district was listed, visited and classified, with its size, its condition and its function recorded. Then came the assessment: the total provision was measured against local standards, and gaps were identified by type and by area. Finally came the strategy: what to protect, what to improve, what to add.
The classification mattered because different kinds of open space serve different purposes. Parks, natural green space, amenity grassland, children's play areas, allotments and playing pitches were counted separately, since a hectare of one is not a substitute for a hectare of another. The audit also recorded quality and value, not just quantity, so a site could be large and still score poorly if it was poorly drained, badly overlooked or hard to reach.
The work was done by councils and by consultants working to the same framework. One archived practice, Ashley Godfrey Associates of Ware, described its own method in service pages that remain on the Wayback Machine: audits of provision, structured consultation, mapping, and critical review of existing policy. The firm ran from 2007 to 2019 and closed when its principal retired, and its pages are now a historical record of how a PPG17 open space assessment was put together in practice. The Harrow open space study is one of the case studies still listed there.
Surveys and audits of local provision
An audit answers a simple question: what have we got, and where is it? The survey behind it is more granular than most people expect. Fieldworkers record each site's boundary, its access points, its surfaces, its furniture, its planting and its condition. They note whether the site is overlooked, whether it floods, whether the paths are usable in winter. They count play equipment by type and age. They record whether the site is publicly accessible or held on a lease.
The results are tabulated by settlement, by ward or by some other reporting area, so that a district average does not hide a local shortfall. A common finding is that provision looks adequate in total but is concentrated in one part of the district, leaving another part below the standard. That is why the assessment is usually reported as a set of local figures rather than one headline number.
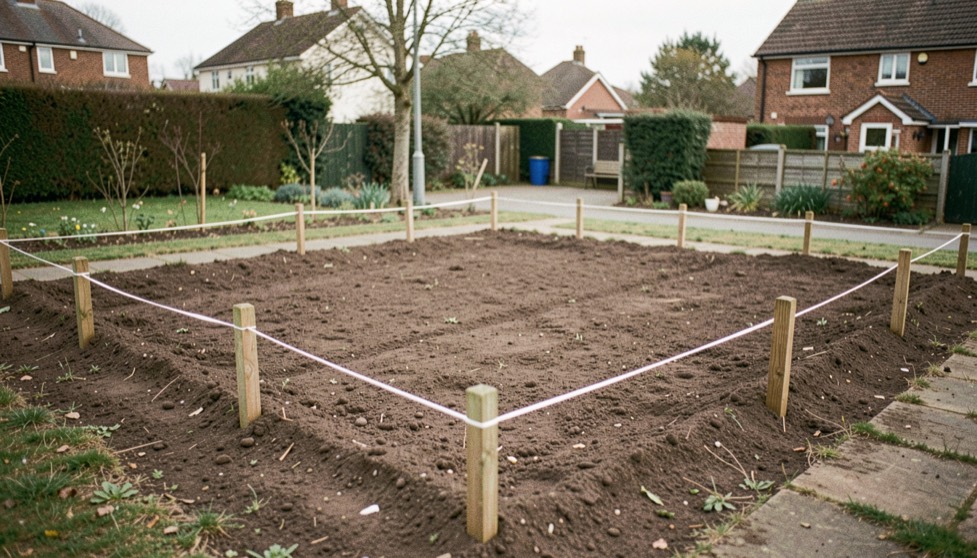
For a plot-holder, the useful part is the discipline of the survey. A plot is small enough to walk in ten minutes, but the same categories apply. What is the actual growing area, as distinct from paths, shed, compost and storage? What is the soil like across the plot, not just at the gate? Where does water sit after rain? Which corners are shaded for most of the day? A written record, made once and updated, is more useful than a memory of what the plot looked like in a good year.
Mapping open space and catchments
A catchment is the area from which people are expected to reach a site. Audits draw these as rings or as walking-distance polygons, often at several thresholds: a small play area within a few minutes' walk, a larger park within a longer one. The catchment is not a claim about who actually visits, but a test of whether the site is placed where people live.
Mapping also reveals overlaps and gaps. Two sites may serve the same streets while a third area has none within the threshold. The map is usually drawn against population data, so the assessment can say not just that a catchment is empty but how many households sit inside it.
The same idea works at plot scale. A gardener can sketch the plot and mark the parts that are reached easily, the parts that need a detour, and the parts that are effectively out of the rotation because they are wet, shaded or awkward. That sketch is a catchment map of one holding. It shows which beds are doing the work and which are only nominally in use.
What does a standard actually measure?
A standard translates a policy aim into a number. It might be expressed as hectares per thousand people, as a maximum distance to the nearest site of each type, or as a minimum quality score. National benchmarks for play are published by Fields in Trust, and the older performance work in the sector was developed with bodies such as Play England and CABE Space. The numbers are not universal: a local standard is adopted because a council has tested it against its own evidence.
The important point is that a standard is a test, not a target to be hit everywhere. A site can meet the quantity standard and fail the quality one. A district can meet the distance standard on average and still leave one estate outside every catchment. The assessment exists to expose those cases.
At plot level, the equivalent is a set of personal standards: so many square metres of bed per household, a maximum distance from the water butt to the far bed, a minimum number of hours of sun on the main cropping area. Writing them down turns a vague sense of a plot being too small or too shaded into something that can be checked and, sometimes, fixed.
What can a plot-holder take from the method?
Three things transfer directly.
Measure before deciding. An audit starts with a survey, not a plan. A plot-holder who measures beds, paths and shaded areas before ordering seeds or moving a shed is working from evidence rather than habit.
Compare against something. A standard, even a self-imposed one, turns a measurement into a judgement. Without it, every plot looks adequate in its own way.
Map the ground. A simple plan showing sun, water, access and use is the plot-scale version of a catchment map. It shows where the effort goes and where it does not.
The archived council studies are worth reading for one further reason. They show how much of the work is ordinary: counting, walking, recording, checking. The same ordinary work, done once a year on a plot, is what makes the difference between a garden that is planned and one that is merely occupied.
Where the archive fits
The service pages and case studies that survive from the 2007 to 2019 period are a record of a particular way of working: evidence first, consultation alongside, strategy last. The clients named in those pages include Erewash Borough Council, the London Borough of Harrow, Medway Council and Nene Park Trust, and the methods described are the ones set out above. The firm is not trading, and nothing here suggests otherwise. It is cited because the method is documented, and because a gardener reading a local open space study will meet the same vocabulary: audit, provision, catchment, standard.
That vocabulary is the useful part. It is the language in which a council explains why a site was protected, improved or lost, and it is the language in which a plot-holder can explain, to themselves at least, why one bed is worked and another is not.
Reading a place before deciding anything is the habit this notebook keeps returning to, whether the subject is reading a garden before you buy or measuring a plot before the first bed is marked out.